Take Home Message
A critical goal of climate change adaptation and disaster risk reduction is to enhance disaster resilience, which is also stressed by the Sendia Framework for Disaster Risk Reduction and the Sustainable Development Goal 13 (Climate Action). However, resilience enhancement necessitates strengthening social and economic cohesion, strong institutional capabilities, and infrastructural development for effective preparedness, response, and quick recovery. In view of this, we here present a preliminary baseline assessment of disaster resilience in Riyadh province, one of the key region in Saudi Arabia. While we have observed a large spatial disparity in resilience (be it overall or sub-domains), there is a dire need to prioritize less resilient districts from the province in order to reduce the impacts of disasters. The interactive dashboard prepared for the communication of disaster resilience serves the need of a disaster resilience decision-support system in Riyadh. Such an interactive platform could potentially act as a prototype, which could further be improved in terms of its comprehensiveness, reliability, and knowledge co-production through multi-institutional involvement and integration of more up-to-date data (as it becomes available). This would lead to overall urban sustainability achievement in the face of global environmental change. The outcomes from this work have important implications to devise a disaster-responsive strategy through informed decision-making, efficient resources allocation, and policy development to cope with natural hazards in the face of climate change. While geography plays a key role in various decision-making processes, map production (both interactive and offline) represents feasible solutions to address complex spatial issues in cities. The index-based spatial assessments can progressively act as proxy substitutes of further in-depth studies that should be carried out at local/block/building scales (i.e., the regions having the least disaster resilience) to support operative adaptation planning in the face of climatic and environmental change. This work acts as a roadmap to scale this investigation up to a national level for a centralized resilience planning, enhancement, and monitoring platform in Saudi Arabia. Such initiative would progressively support the national efforts to build a resilient Saudi Arabia in the coming future. References: Al-Bassam, A. M., Zaidi, F. K., & Hussein, M. T. (2014). Natural hazards in Saudi Arabia. Extreme natural events, disaster risks and societal implications, 243-251. Hosseini, S., Barker, K., & Ramirez-Marquez, J. E. (2016). A review of definitions and measures of system resilience. Reliability Engineering & System Safety, 145, 47–61. https://doi.org/10.1016/j.ress.2015.08.006 Sajjad, M., Chan, J. C., & Chopra, S. S. (2021). Rethinking disaster resilience in high-density cities: Towards an urban resilience knowledge system. Sustainable Cities and Society, 69, 102850. Sajjad, M. (2021). Disaster resilience in Pakistan: A comprehensive multi-dimensional spatial profiling. Applied geography, 126, 102367. Sajjad, M., & Chan, J. C. (2019). Risk assessment for the sustainability of coastal communities: A preliminary study. Science of the Total Environment, 671, 339-350. Mackres, E. (2023). New Data Dashboard Helps Cities Build Urban Resilience in a Changing Climate. World Resources Institute. Accessed July 25, 2024. Available at: https://www.wri.org/update/new-data-dashboard-shows-climate-change-risks-in-cities
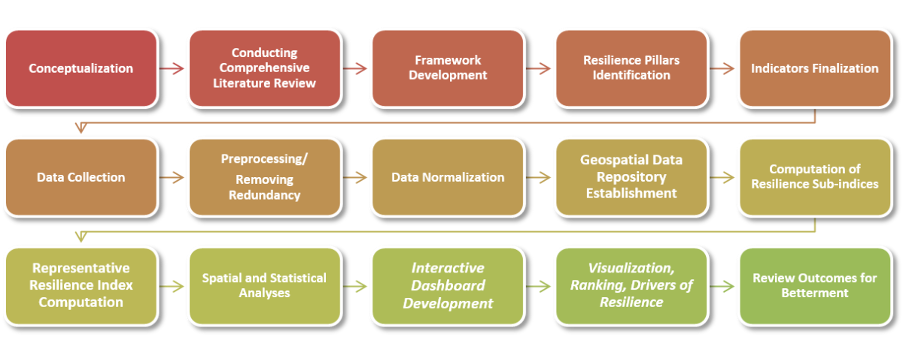
Resilience assessment and dashboard development workflow
Below we have developed disaster resilience dashboard for Riyadh Province.
The data to compute overall resilience and its sub-components (i.e., social, economic, infrastructural, and institutional) are curated from multiple sources, such as government agencies, remote sensing, and open geo-data platforms.
Key concepts of Resilience Dashboard
- Resilience: the ability of an urban system (i.e., social, economic, infrastructure, and institutions) to maintain essential functions and quickly recover from shocks and stresses caused by disasters, while adapting and transforming to enhance future preparedness and sustainability ( Sajjad 2021 ).
- Resilience Score: a comparative value ranging between 0-100, where values closer to 100 represent relatively higher resilience and vice versa. The value is obtained systematically using the resilience assessment framework.
- Overall Minimum Resiliency: Minimum resilience score represented as a percentile compared with all the evaluated districts in Riyadh Province. The higher the value, the better the overall resilience situation.
- Overall Average Resiliency: Average resilience score computed across all the districts and represented as a percentile compared with all the evaluated districts in Riyadh Province. The higher the value, the better the overall resilience situation. Usually, the average resiliency is used as a benchmark to evaluate the resilience status of any district (i.e., if the resilience of a specific region is above or below the overall average).
- Overall Maximum Resiliency: Maximum resilience score represented as a percentile compared with all the evaluated districts in Riyadh Province. The higher the value, the better the overall resilience situation. Interactive Maps: Interactive maps are integral to dashboards to represent the spatial distributions of the situation under consideration (i.e., resilience and its sub-components). This is particularly helpful to identify and pin-point relatively less-resilient regions for immediate or gradual actions across the regions.
- Analytics: Statistical analytics are key components of interactive dashboards as they are essential to gauge the overall resilience situation. These could include comparative bar-charts, resilience score-cards, or map pop-ups with variable summaries. Furthermore, these analytics are filtered out based on the interactivity among different dashboard components (i.e., clicking a specific map would filter out the other resilience analytics).
- Video Panel: A video panel is included to explain the key concepts and elaborate on the resilience dashboard. This is particularly helpful to support users get the most out of the resilience dashboard.