Key concepts of Resilience Dashboard
- Resilience: the ability of an urban system (i.e., social, economic, infrastructure, and institutions) to maintain essential functions and quickly recover from shocks and stresses caused by disasters, while adapting and transforming to enhance future preparedness and sustainability ( Sajjad 2021 ).
- Resilience Score: a comparative value ranging between 0-100, where values closer to 100 represent relatively higher resilience and vice versa. The value is obtained systematically using the resilience assessment framework.
- Overall Minimum Resiliency: Minimum resilience score represented as a percentile compared with all the evaluated districts in Riyadh Province. The higher the value, the better the overall resilience situation.
- Overall Average Resiliency: Average resilience score computed across all the districts and represented as a percentile compared with all the evaluated districts in Riyadh Province. The higher the value, the better the overall resilience situation. Usually, the average resiliency is used as a benchmark to evaluate the resilience status of any district (i.e., if the resilience of a specific region is above or below the overall average).
- Overall Maximum Resiliency: Maximum resilience score represented as a percentile compared with all the evaluated districts in Riyadh Province. The higher the value, the better the overall resilience situation. Interactive Maps: Interactive maps are integral to dashboards to represent the spatial distributions of the situation under consideration (i.e., resilience and its sub-components). This is particularly helpful to identify and pin-point relatively less-resilient regions for immediate or gradual actions across the regions.
- Analytics: Statistical analytics are key components of interactive dashboards as they are essential to gauge the overall resilience situation. These could include comparative bar-charts, resilience score-cards, or map pop-ups with variable summaries. Furthermore, these analytics are filtered out based on the interactivity among different dashboard components (i.e., clicking a specific map would filter out the other resilience analytics).
- Video Panel: A video panel is included to explain the key concepts and elaborate on the resilience dashboard. This is particularly helpful to support users get the most out of the resilience dashboard.
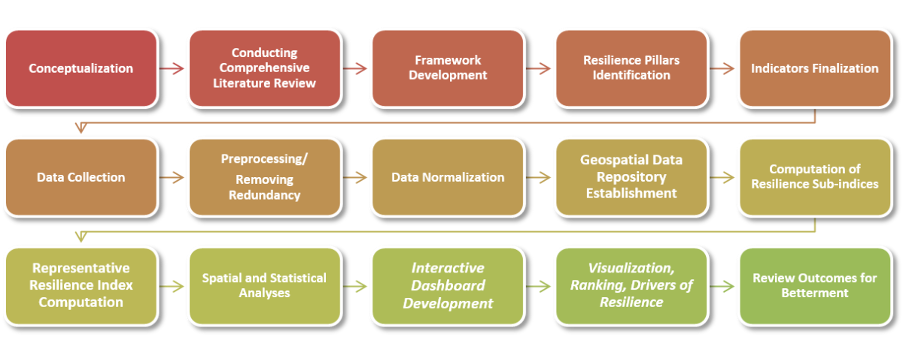
Resilience assessment and dashboard development workflow
Below we have developed disaster resilience dashboard for Riyadh Province.
The data to compute overall resilience and its sub-components (i.e., social, economic, infrastructural, and institutional) are curated from multiple sources, such as government agencies, remote sensing, and open geo-data platforms.
Key concepts of Resilience Dashboard
- Resilience: the ability of an urban system (i.e., social, economic, infrastructure, and institutions) to maintain essential functions and quickly recover from shocks and stresses caused by disasters, while adapting and transforming to enhance future preparedness and sustainability ( Sajjad 2021 ).
- Resilience Score: a comparative value ranging between 0-100, where values closer to 100 represent relatively higher resilience and vice versa. The value is obtained systematically using the resilience assessment framework.
- Overall Minimum Resiliency: Minimum resilience score represented as a percentile compared with all the evaluated districts in Riyadh Province. The higher the value, the better the overall resilience situation.
- Overall Average Resiliency: Average resilience score computed across all the districts and represented as a percentile compared with all the evaluated districts in Riyadh Province. The higher the value, the better the overall resilience situation. Usually, the average resiliency is used as a benchmark to evaluate the resilience status of any district (i.e., if the resilience of a specific region is above or below the overall average).
- Overall Maximum Resiliency: Maximum resilience score represented as a percentile compared with all the evaluated districts in Riyadh Province. The higher the value, the better the overall resilience situation. Interactive Maps: Interactive maps are integral to dashboards to represent the spatial distributions of the situation under consideration (i.e., resilience and its sub-components). This is particularly helpful to identify and pin-point relatively less-resilient regions for immediate or gradual actions across the regions.
- Analytics: Statistical analytics are key components of interactive dashboards as they are essential to gauge the overall resilience situation. These could include comparative bar-charts, resilience score-cards, or map pop-ups with variable summaries. Furthermore, these analytics are filtered out based on the interactivity among different dashboard components (i.e., clicking a specific map would filter out the other resilience analytics).
- Video Panel: A video panel is included to explain the key concepts and elaborate on the resilience dashboard. This is particularly helpful to support users get the most out of the resilience dashboard.